Model of skill acquisition
Posted on: October 18, 2010
If you have ever been a manager and managed team of people, you’ll identify with this…
Novice: ants to be given a manual, told what to do, with no decisions possible
Advanced beginner: needs a bit of freedom, but is unable to quickly describe a hierarchy of which parts are more important than others
Competent: wants the ability to make plans, create routines and choose among activities
Proficient: The more freedom you offer, the more you expect, the more you’ll get
Expert: writes the manual, doesn’t follow it.
As discussed in my earlier post(Extensibility Design), an extensible design provides the ability to customize an enterprise application software to server business needs of different customers. Extensibility is critical to the application software vendor especially if the software is delivered through a SaaS or On-Demand model. The underlying application architecture should support a metadata based model, which will provide a framework to extend the out of the box application to suite different customers’ needs. The framework should provide a generalized mechanism to construct application components to build the software.
The generalized mechanism for extensibility will mainly provide following three features.
- Data Model Extensibility: The end users should be able to manage attributes with in a business objects. They should be able to add a new attribute of any data type and define rules for it.
- UI Extensibility: The end users should be able to add new attribute to the UI forms as a field and the data can be added/modified using these fields. The field can be either simple editable text, number (such as amount, percentage), lookup or even media object (such as image, video) etc.,
- Security Privileges: The design should take in to account that can extend a business object and once extended who can view and manage these extended attribute.
Data Model Extensibility
Data model extensibility is achieved through flexible attributes. Flexible attributes are generic attributes that is associated with a logical business objects. Flexible attributes are of generic data type (such as Raw) and can hold data of any type. The data will be stored as raw bytes and will be converted to appropriate data type on the business layer before transaction processing. An example of flexible attribute for CRM Opportunity object is given below.

UI Extensibility
UI Extensibility refers to the ability to add a field on runtime to a page. A ‘customize’ link will bring up the extensibility editor which will allow the users to create a new field in the form. The editor will prompt the user to enter the label and type. The types can either text, number of lookup. If lookup is chosen, then the editor will prompt the user to enter the lookup items. The user can also choose other properties such as required field and validation rules (not shown in wireframe below).

Security Privileges
The visibility of extended attributes and fields will depend on the security privileges. The attributes in the data model will inherit the data security policy defined for the logical business object and the function security will depend on any of the following.
- Organization Hierarchy: The field can be made visible to the any of the organization hierarchy defined such as sales org, marketing organization etc.,
- Employee Hierarchy: The field can be made visible to the any of the employee hierarchy defined. The administrator will choose a sales VP and all employees reporting under sales VP will see the fields.
- All Users: The field can be made visible to all the uses with in a enterprise.
It should be noted that in a SaaS model, the customization will be visible only to those who extends the product. Subscribers’ from other customers will not be able to see these changes.
Multi Currency Design
Posted on: January 24, 2010
Multinational companies generally have operations in multiple countries and they have requirement to run transactions with multiple currencies. They need to be able to see the amounts used in transaction (Budgets, sales revenue, sales targets etc.,) in multiple currencies with current and historical exchange rates.
For example, consider a multinational company with head quarters in US having operations in Japan and Europe. The company’s sales budget is determined in centrally in US for all their subsidiaries all over the world. The CEO, based in US will allocate the budget in US dollars to these subsidiaries and the head of Europe and Japan review the sales budgets. The head of Europe and Japan are in their respective countries and will review the sales budget in EURO and Japanese Yen. On the surface, this isn’t a major issue since the software will convert the US dollar to Euro and Yen using current exchange rate. If you scratch the surface you’ll see that currency exchange rate is not constant and it fluctuates almost daily and sometimes it has wild swings. The sales head for Europe cannot be shown different sales budget every day due to currency fluctuations. Conversely there are situations where the CEO needs to see an amount always with current exchange rate. Typically while a transaction is in progress, in this case while the CEO is still planning to allocate the budget, he may want to see the EURO equivalent of the sales budget before publishing to the respective subsidiaries.
This is typical application design issues and the enterprise applications will have following terminologies introduced to address these issue.
- User Preferred Currency: This currency will be associated with every user of the software and it will generally depend on user’s native location. In the example above, CEO will have US dollars as user preferred currency and head of sales for Europe will have EURO as the user preferred currency. The application will always default all amount in user preferred currency.
- Current Exchange Rate: This is the exchange rate for any currency as of today’s date. This information will be available either thru financial institutions (thru Web Services) or application can set default exchange rate within their schema.
- Transaction Exchange Rate: This is the current exchange rate of a day when transaction was completed. The transaction completed date and current exchange rate on that day for all currencies supported will be stored in a transaction exchange rate table in schema. In the example above, when the CEO publishes the sales budget, the date when the sales budget was published and the current exchange rate of all the currencies will be stored in a table as given below
|
Date |
Currency |
Exchange Rate |
|
1/24/2010 |
EURO |
0.707 |
|
1/24/2010 |
YEN |
89.93 |
Multi currency design is explained in the process given below.
- The CEO logs in to the system to allocate sales budgets.
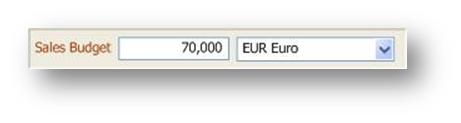
- The CEO will see the sales budget in user preferred currency by default, as shown. The CEO will be able to change the currency to other supported currencies and see the amount.

- Once the CEO completes a the transaction by publishing the budget, the amount will be stored in user preferred currency along with transaction date and exchange rate as show below in the transaction schema.
|
Amount |
Currency |
Transaction Date |
|
100,000 |
USD |
1/24/2010 |
- The Europe sales VP will login to the application to view the budget.
- The application will identify the user preferred currency (i.e. EURO), currency code and transaction date of the sales budget from the transaction schema.
- It will look up the transaction exchange rate table to find out the transaction exchange rate for USD on the transaction date.
- If available, it wi
 ll apply the transaction exchange rate to the sales budget and will display it to the user as shown below.
Enterprise Software products are unique and generally different organizations use it differently. It will be rare or impossible to see enterprise software used without modifications by enterprises. A typical enterprise has unique needs based on their organization structure and they customize the software available off the shelf. They hire functional and technical consultants, who have expert level knowledge of underlying technology and functionality to perform these customizations. The nature of customization could be either simple UI change, data model change or it could even more complex such as behavioral change (i.e. configuring workflows, adding business rules etc.,) or third party integrations. The consultants will typically make changes to the application source code and would require source code maintenance with the enterprise.
With the emergence of SaaS delivery model and multi-tenancy needed to achieve economies of scale, software customization for individual is not a viable option. The vendor will not be able to maintain versions of software for every customer and with software available on cloud the enterprises cannot maintain source code in house. At the same time, customers should be able to extend the product functionality to suit their needs. Software extensibility framework helps software to be customization without a need to change the underlying source code. A good extensibility framework design will allow the end users to customize the software and these customization will be visible only in the instance which the customer is accessing.
An extensible design can be categorized as following.
- UI Extensibility: The user interface layer should be extensible and the customer should be able to customize the look and feel of the application. This customization can range from changing colors, application branding (i.e. changing logos), changing widgets look and feel and advanced customization such as customizing label texts, show/hide UI widgets, customizing error messages etc.,
- Data Model Extensibility: The end users should be able to extend the data model for any object. They should be able to add a new field to the form and add data to it. The field can be of any data type including the multimedia content. The application should allow for defining validation rules and lookup values. Note that the data model extensibility generally doesn’t allow for creating data model or re-defining object relationships.
- Workflow Extensibility: A typical business process consists of a workflow that is sequence of connected steps helps complete a task. The extensibility should allow the end users to configure these workflow steps (i.e. add/delete a step), define business rules, add notifications etc.,
I will discuss each of these with an example in my subsequent posts.
Data visualization is the study of visually representing data for the purpose of effective communication of data through visual means. Data visualization will improve the aesthetics (you no longer have to see the boring tables and standard widgets) and improve the intuitiveness of the data being resented. Data visualization is a effective tool to present the information to the user in a way it maps the representation they have in their mind.
Apart from BI and analytics where there is a need to represent data as charts, enterprise software designers overlooked the need for visually representing data in transactional pages. This is predominantly due to technical limitation with web browsers and the technology used to develop the UI layer. With the proliferation of Rich Internet Application (RIA) frameworks (Adobe Flex, JaveFX etc), representing data on web browsers is feasible and gives an opportunity for the software designers to take a re-look at their data representation philosophies.
Data visualization and RIA presents enterprise software designers with an opportunity to represent the regular enterprise transactional data as graphics. When designed correctly, it automatically enhances the user experience and usability of the application. Enterprise data models are inherently complex structures with complicated relationships among them. These data models represent enterprise objects and their relationship with each others. The users of the enterprise software generally have a mental model of these data. After all they work and interact with these objects in their day-to-day work life and use the enterprise software to effectively communicate a job. Successful data visualization should map the mental model and represent the mind map on the screen. This immediately creates a trust between the software and user and makes the user interaction simpler and effective.
Let’s take an example of sales manager of a high tech company selling laptops and desktop computers to large companies. He will have a team of sales representatives reporting in to him. He will have a typical mental model about the customers, sales reps engaging with these customers, the sales targets and current status. He knows the relationships these have among each other and he can visually imagine this in his mind. These objects such as customer, sales reps, products, targets and status are available in the enterprise data model as data in rows and column. The data by itself is complex and its representations as rows and column is difficult to comprehend and doesn’t match the mental model the user has.
The mental model of a sales manager looks like this.

With data visualization using rich internet applications, this mental model can be captured in the design below. With a click of a button (on the sales representative node), the sales manager can view the open pipeline for the customer. The design exactly maps the image that sales manager has in his mind and don’t have to wade through the maze of HTML table to find out the information.

- In: Design | Enterprise 2.0 | Enterprise Software | Usability | Web 2.0
- 1 Comment
What is Enterprise 2.0?
Enterprise 2.0 is the latest buzzword that is generating interest in corporate IT circles and software vendor’s boardroom. The word was coined by Harvard university professor and as I understand this is about bringing Web 2.0 collaboration tools and techniques such as social media, wikis, blogs, twitter etc., in to corporate computing environment. Forrester predicts the market will grow to 4 billion US$ and will revolutionize the collaboration within the enterprises.
Enterprise 2.0 – Problem
While Enterprise 2.0 is great idea and has the potential to increase efficiency of corporate collaboration, it only focuses on collaboration between knowledge workers. The benefits Web 2.0 of should reach the entire spectrum of corporate users such as sales, finance, administration and HR. Also, the users will not use it just for the sake of better collaboration unless or until it makes them more efficient and helps them complete their tasks quickly and efficiently. As enterprise software users, we already use quite a lot of applications in our day-to-day operation and having to use couple of more tools just for collaboration is not going to easy. The unique feature of online social media applications such as FaceBook and MySpace is provides better way (or incremental innovation over email/chat) way for people to share and collaborate. These applications allow the users to share an object of interest with their friends and then collaborate among them. It the object of interest could either be a picture, a video (uploaded in YouTube), a blog post or just a status message. Since this is an object of interest for many people, they get attracted to it and start posting comments on it. This way the collaboration begins and you people have meaning discussion around it.
Enterprise 2.0 – What it should be
Enterprise 2.0 should ideally be a platform through which all enterprise applications are offered. The application will be the object of interest for the corporate users and they will collaborate among selves to solve problems and complete their task. For example, an employee will typically use a HR self service type of an application to apply leave. If the leave application is rejected, then he will connect with manager. The leave application is the object of interest and entire process of applying for a leave, approval/rejection flow and subsequent communication should be offered within on top of Enterprise 2.0 platform. The object of interest should not be restricted to just one application. It should cover entire gamut of application from HR self service, to expense systems to complex application such as CRM/ERP and analytics. This provides a consistency in interaction with every enterprise application increase adoption of not only the Enterprise 2.0 platform but other applications as well. (Though there are technical challenges, Enterprise 2.0 needs to overcome this to succeed in enterprise environments).
To illustrate with an example, take a look at the screen shot below. This is how a typical Enterprise 2.0 platform home page should look like (Heavily inspired from Facebook and Orkut). On the right hand side, it displays all the application that every employee will use to access information and complete a task. This includes benefits administration, payroll application and time card application. It also allows the user to add other applications that enterprise provides that they may need to use such as document management, knowledge base and CRM Portal. On the left hand side, the application displays the names of peers and managers. The user can add other employees and group them as shown.

On the center, application displays live updates. As you can see, it tells the user that one of his direct reports, Bruce Johnson has submitted an expense report for approval. Jene has completed a design document and she is waiting for him to review it and his very own leave application is approved by his manager. If you observe carefully these are three different applications (and possibly from three different software vendors) i.e.. expense management system, document management system and time card application. All these three are provided within one single Enterprise 2.0 platform and the user can seamlessly move between these applications. The e is no need for user need not switch from one application to another, nor view different applications with different user experience and then complete their task.

The application allows user to see the details of the expense embedded within it (by clicking ‘Show More’). The user sees that Bruce has only entered expense for a day and he wants all the expense as one single report. So user clicks on the ‘Ask details’ button and enters the comment as shown. Bruce sees the same comment when he logs in to the Enterprise 2.0 tool as a live update and he will respond to it in a similar way. The user didn’t use different application and mediums (i.e. email, chat or phone) for collaboration.
- In: Analytics | CRM | Design | On Demand | On Premise | Predictive Analysis | Usability
- Leave a Comment
Introduction
Predictive analytics is the latest buzzword in the enterprise software industry and it you go by predictions from industry watchers, every vendor will offer predictive analytics solutions. With most enterprise vendors acquiring predictive analysis technologies (i.e. Oracle acquired Hyperion, SAP acquired business objects and IBM acquired SPSS) we would definitely see some predictive analytics solution coming out from these companies. The customers are more than happy to give predictive analysis a try and why not in this economic malaise, if somebody is offering a sneak peek in to what’s in store in future, then why not.
Predictive Analytics
Predictive analytics is a technique by which the current and historical data are analyzed either thru sophisticated data mining tools or (and) applying statistical techniques to predict a future event. The future event could be predicting future sales, employee performance, budget requirements etc. The output could be either a detailed report (i.e. table, chart) or it could just be a single number. Predictive analytics is different from the traditional BI analytics in that predictive analytics looks at the present and historical data and predicts a future event where as tradition BI analytics looks same date and provides insights in to these data such sales by products, sales by territories etc.,
Traditionally application vendors provided predictive analytics tool as separate software that needs to be integrated with the existing database systems. Some tools will read the data directly from OLTP and data warehouse sources where as some other will define its own multi-dimension database (or cube) to load data in to it. These tools are capable for implementing sophisticated statistical techniques such as linear regression, time series forecasting, prediction model etc. The end users of these tools should be well versed with the business data, data warehouse concepts and statistical algorithms to effectively use these tools.
Pain Points
Though predictive analysis software offers real business benefit to enterprises, it is only used by very few with the enterprise. This is due the fact that majority of the enterprise users such sales managers, HR managers are not statistics expert and usually they don’t have enough bandwidth to engage statisticians and dive in to the maze of enterprise data. Senior executives such as the C’ level executives and VPs use these with the help of these experts. They basically use these to make important business decision such as budget allocation, high level territory performance and forecast etc. Most often these tools are not used regular day-to-day users.
To bring the benefits of predictive analysis to the end users, I suggest the following.
- Embed predictive analytics in to transaction pages
- Helps complete a business process
- Avoid technical and statistical terms in UI as much as possible.
- Do not over engineer
Design Solution
The example given below predicts the future sales of a particular product. It looks at the historical data ( i.e. from Jan – Sep ) and predicts the sales for the next quarter. This analytics will be used by a sales manager to view the sales target and the predicted sales through out a calendar year.The sales manager will use this tool to better plan and align the sales resources.
Month Sales No of sales rep
Jan $100,000 1
Feb $120,000 3
Mar $123,000 3
Apr $110,000 2
May $112,000 2
Jun $119,000 3
Jul $115,000 4
Aug $110,000 2
Sep $100,000 2
Product Category Customer Category Sales
Desktop 2M-3M $112,000
Desktop 3M-5M $140,000
Printer 2M-3M $120,000
Printer 3M-5M $150,000
Laptop 2M-3M $122,000
Laptop 3M-5M $115,000
Services 2M-3M $120,000
Services 3M-5M $130,000

The application uses time linear time series regression model to compute the future sales. The predictive model uses the following dependent variable to predict the future sales.
- Potential Revenue in pipeline
- No. of sales rep reporting to sales manager
- Product category sold
- Customer size
The sales manager can either use the standard forecasting method or use any of the standard averaging technique to predict the quota. Though this is little too technical for a enterprise user, having different technique till help the manager look at the other model and minimize errors and risk and it will give him confidence in the prediction.
The predicted sales and the red bar in the chart will change as and when any change is made. The model uses the liner regression with any of the chosen method and uses the time series forecasting to predict the future sales for the coming months and quarters. The user can adjust the dependent variables view real-time how the sales will be for next quarter and he can continue to do it until the target value is reached. At the end of the prediction, the end user will know what should the pipeline revenue, how many sales rep, what products should be sold to what kind of customers will be known and the he can strategize the sales activities
- In: Design | Enterprise Software | On Demand | On Premise | Pull Factor | SaaS
- Leave a Comment
Software as a Service (or On-demand applications) has evolved tremendously over the past couple of years. After the success of companies such as salesforce.com and Netsuite, even the traditional on-premise vendors have started delivering their applications on an on-demand and hybrid model. This presents a disruptive change and challenges to the vendors, customer and integration partners on how they conduct their business. Gone are the days when a vendor used to sell a product for a fixed license cost and is assured of maintenance revenue every year. The customers no longer have to make huge capital expenditure to make the application and system work since it has been purchased. The system integration partners can no longer offer implementation and customization services. In the SaaS (or on demand) vs on premise series of posts, I’ll discuss these challenges faced by the entire enterprise software eco-system and how it can be overcome with smart design.
On traditional on-premise model, once the customers buy enterprise software, they will ensure that software is implemented, customized and used by all its employees. They will spend much more (which incidentally forms the bulk of the TCO) than the application cost to implement the software. They need to hire expensive business and technical consultants who will help them define business process, customize the application and get the application up and running for the employees to use. Since most software implementation brings in big changes with-in the organization, they need to conduct elaborate training program with the help of partners and enterprise software vendors to bring the employees up to speed. Even after the successful implementation and training, there is no guarantee that the software will be used across the enterprise. If the software is not used by the employees (due to poor user experience or poor short term benefits to the users), then the entire customer’s investment goes in vain. There is no incentive for the application software vendors to make the software useful to their clients.
On an on-demand model there is no compulsion on customers somehow make the software work since there is no upfront investment. They can use the software on a trial basis and if the software is not used within the organization (due to poor design or no apparent benefits emerging out of software or don’t add value to the company), then there is good chance that the customer can easily switch to another vendor or just stop using the software. The customer can terminate the subscription and recurring revenue tap will be turned off for the enterprise software vendor.
The software vendors will realize the fact that its not enough to deliver a software that is feature rich, moderately useable and with accepted quality standards. They need to ensure that the software is usable, adaptable and provides short term clear benefits to the end user that’s attracts them towards the software. The software needs to be exciting to end user and it should have a ‘pull factor’ that makes the users come back to the application.
To create the ‘pull factor’ and make the software compelling for the user, the software needs to display new and relevant content to end users each and every time they login to the application. This feature is used in social media application on internet as Facebook and youTube, where you would see different content relevant to the logged in user every time they login. Or take an example of a simple email application (Gmail, Hotmail etc.,) which attracts the users since new content (or emails) are displayed every time the user logs in. As the users start using the application, he would start creating more content (i.e. incoming emails, outgoing emails, contacts etc.,) over a period of time. Once a huge amount of content is created, then moving to another application becomes tedious and virtually an impossible task. Similar pull factor can be created on the enterprise on demand such that the user will be attracted to the software and over a period of time will create enormous content the users cannot live without the application and moving to another application will tedious and time consuming.

One such design idea I have for the pull factor is displaying enterprise updates as live feeds. The application can configure events and when the event occurs the application will detect the event and will be displayed on the users’ screen whenever the user logs in. The end users are always curious to know about the information that is going around within the organization and relevant to them. A smart organization will use this to drive the employee performance as well. For example, a sales representative always wants to know what changes are made to the sales organization, how do they performed against the peers, who’s the top sales person in a week or month, information about key deals, discount offered etc., Optionally these live feeds can drive the user to complete tasks.
Enterprise Software on Smart phones
Mobile phones and smart phones are driving internet usage and it’s predicted that it will overtake the preferred medium for accessing internet in the future. Most popular internet application (Email, YouTube, Facebook etc.,) has a mobile application and increasing people are using these applications from their mobile phone. The enterprise users expect the enterprise software be available on mobile and executives who are mobile such as (sales representative, field sales technician etc.) it’s a must have and influences their productivity.
Designing and developing application for smart phones has its own issues that include lower bandwidth, different screen size and resolution of the device, device capability etc. The application vendor will typically deliver two different versions of same application, one for smart phones and one for the desktop computers. This approach has its own limitations.
- Development Overhead: The application vendor will have two dedicated team to develop and maintain such applications. This increases the development and maintenance cost and other overhead associated with having two teams.
- Non-standard devices: No two handheld devices (from different vendor such as Nokia smart phones and iPhone) have standard capabilities and come with its own limitations. Designing applications for such devices are tedious and time consuming
- User experience: The user experience between the mobile application and desktop application is almost always very different and user doesn’t relate between these applications.
The limitation mentioned above can be overcome with maturing technologies (i.e. Adobe flex open source framework) and smart design. The solution lies in using Zoomable User Interface.
Zoomable User Interface
The zoomable user interface allows the user to zoom-in and zoom-out of content displayed in the user interface. This is similar to Google Maps where we can zoom-in and zoom-out to view details on the map such as country, state, city and roads. These zoomable user interfaces allows application developers to define the content to be displays depending upon zoom factor i.e. how much the user has zoomed. By defining the content for zoom factor, the same application can be used both in mobile devices and desktop (esp. internet based application that works on a browser). Typically zoom factor takes in account the number of pixels available to render the page and once defined the same application can be accessed over the internet. The mobile phone with smaller screen will have smaller zoom factor and so only those content will be displayed where the same application when accessed from a desktop will display much more content. On the mobile phone, the user can pan (i.e. drag the screen on all directions) to view all the content.
As usual let me take an example and explain. Take an example of simple contact management application. The application will allow the users to add and update a contact. The sample user interface screen for the desktop application looks below.

It displays the complete page with maximum zoom factor. It has all the contents that the page contains. Typically application will define a set resolutions, say 1024 X 768 to be the maximum or 100% zoom factor and it will confirm to a typical desktop resolution. The application developer will define all the controls that are to be displayed for this zoom factor. And then the developer will define controls to be displayed for different zoom factor such 25%, 50%, 75% etc., The user can view the application with 25% zoom factor initially with limited controls in it and zoom-in to view more control as defined by the application developer.
The zoom factor is basically the different screen resolution available for (i.e. 25% zoom factor is 200 * 150, 50% zoom factor is 450 * 300 etc.) rendering the page. When the application is accessed from smart phones with a certain screen resolution, the application will display content for appropriate zoom factor i.e. the iPhone has a screen resolution of 480 * 350, so 50% zoom factor will be displayed as shown below). The user can zoom out, drag the screen on either direction to access the entire page.


Design Advantages
- Multiple devices support: One design will support various devices including Smart phones, Netbooks and desktop computers (with different resolutions).
- One application: The application vendors will have only one application. No integration or repetition of backend transactions involved.
- Consistency: There is a consistency in UI between the mobile and desktop applications and provides seamless switch between these applications.
- Intuitive: The application is intuitive since zoom and pan designs are widely used in maps and other picture viewing application and the user knows that zoom always display details of the object being viewed.
Comments welcome..
The 80/20 Rule
Posted on: December 11, 2009
There is an unwritten rule and widespread acknowledgment within the software industry that 80% of end users of enterprise software’s only use 20% of the features provided in an application. Imagine how many times we have used all the features available in our word processing software such as tracking changes, creating envelopes, inserting citation etc. Most of the time we only use common features such as create a document, format the document and then print it. That’s it.
Enterprise software vendors in a race to expand and capture market share, offer a number of features in their applications. It could range from a simple data entry to complex work flow solutions. The product team incrementally adds these features in to the product and to increase the demonstration capability of the product and to reduce number of clicks, they bury the entire feature in one single screen. They fill up every single pixel on the screen with UI widgets such as links and text fields. While this makes the look product feature intensive and reduces the number of clicks, it also clutters the screen and the amount of information display the end user is simply overwhelming. While reducing the number of clicks is a good idea, it shouldn’t be at the expense of clarity and usability. Once such screen is given below

This screen was designed by team who doesn’t know which feature is critical to customers and instead offered all the features in one single screen. There are following disadvantages with this approach.
- Too much information on the screen.
- UI is cluttered and unstructured.
- It offers too many features such as opportunity editing, adding products, adding contacts and interested parties, adding attachment and notes.
Does this mean that enterprise application shouldn’t deliver many features and Shouldn’t cater to the rest of the 20% of the market? No. They should and an intelligent design would help them do all these.
A typical sales representative is interested in creating a opportunity and recording its revenue. All other features such as contacts, attachments and notes though are good to have but are not critical to complete the sales process. So I recommend a design that by default hides all other details other than the critical ones. The sales rep will have a UI widget (a link) that will allow him to show and hide these features. I would redesign as it’s given below.

The sales representative, as they get comfortable with the common features will start exploring the hidden features and will start using as they deem fit. This design makes a clear distinction between what is critical to a sales representative and will coerce him to start looking to other features provided. This will allow for the entire software to be voluntarily adopted by the end user.The are apparent advantages of this design is given below
- There is no information overload.
- The information displayed is structured and uncluttered.
- The design is self evident. The user knows what he can accomplish my looking the page
